Total population
On 21 March 2021 (census day), the resident population of Jersey was 103,267.
The most recently published population estimate for Jersey was 107,800 at 31 December 2019.
Jersey population for the period 1821 to 2021
Source: Statistics Jersey,
download the chart data
Note: population figures from 1821 to 1951 include visitors not ordinarily resident. Figures from 1981 to 2021 include temporarily absent residents.
Population estimates for the period 2008 to 2022
2008
| 95,400
|
|
2009 | 96,200
|
|
2010 | 97,100 |
2011
| 97,900
|
|
2012 | 98,600
|
|
2013 | 99,300
|
| 2014 | 100,100
|
| 2015 | 101,200
|
| 2016 | 102,200 |
2017
| 102,700
|
| 2018 | 103,300
|
2019
| 103,300
|
2020
| 103,500
|
|---|
2021
| 103,200
|
|---|
2022
| 103,200
|
|---|
Age structure
In 2021, 66% of the total resident population were of working age (women and men aged 16 to 64 years). About a sixth (18%) were above working age and another sixth (16%) below working age. These proportions have been substantially constant since 1981.
Age structure with respect to working age for the period 1971 to 2021
Source: Statistics Jersey,
download the chart data
Note: school leaving age increased in 1992 from 15 to 16 years of age. Also, changes to pension ages were agreed in 2011. 2021 data therefore treats working age as 16 to 64 for both males and females. Prior to this it was 16 to 64 for males and 16 to 59 for females.
Residential status
The census records the residential status of all adults (aged 16 and above) in Jersey. Of the 86,791 adults in the March 2021 census:
- 86% had Entitled status
- 6% had Entitled for work status
- 5% had Registered status
- 2% had Licenced status
Residential qualification data in 2011 is only broadly comparable due to the changes in residential housing qualifications implemented in July 2013 under the Control of Housing and Work (Jersey) Law 2012.
In 2011, 16% of the adult population did not have residential housing qualifications. The proportion of adults with the equivalent status in 2021 has decreased to 11%. (people either Registered or Entitled for work).
Population density
The population density of Jersey is approximately three times that of England and about a sixth less than Guernsey. The figure below shows the pattern of population density across the Island.
Population density in Jersey by enumeration district, (Census 2021)
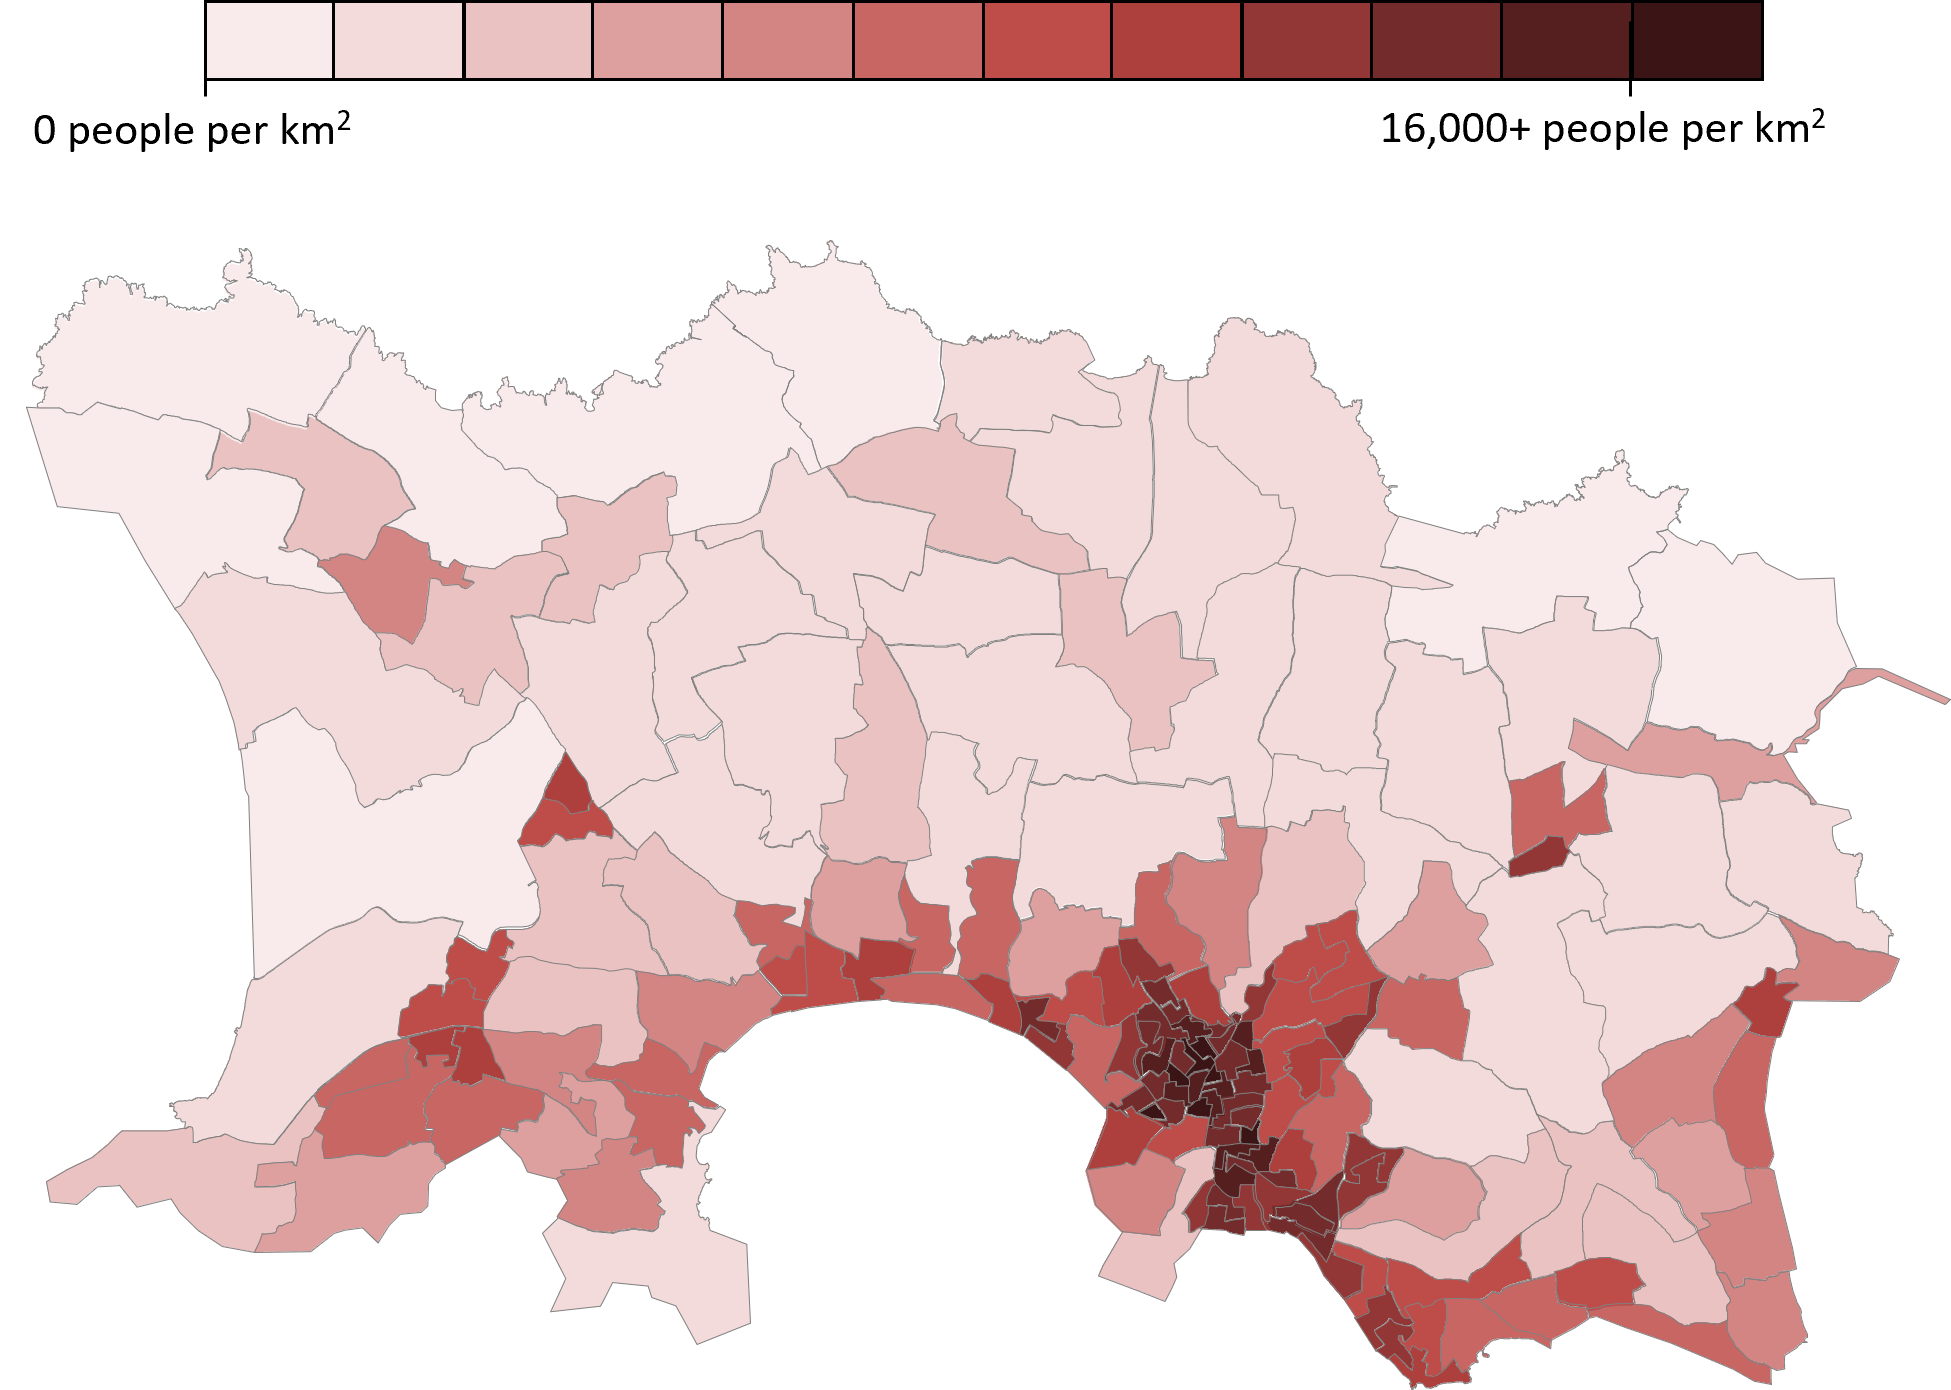
Source: Statistics Jersey
Place of birth
At the time of the 2021 census, half (50%) of the population were born in Jersey. A further 29% were born elsewhere in the British Isles.
Jersey population by place of birth in 2021
Source: Statistics Jersey,
download the chart data
From the 1970s to 1990s the majority of ‘Other Europeans’ arriving in Jersey were from Portugal or Madeira. A significant change has occurred in recent years with the proportion arriving from Portugal or Madeira falling. In contrast, the proportion arriving from Poland and Romania has increased.
Place of birth of Jersey residents for the period 1991 to 2021
Source: Statistics Jersey,
download the chart data
Marital status
In 2021, 45% of adults in Jersey were either married or re-married (including same-sex marriages). A further 11% were divorced, whilst 35% had never married.
Profile of marital status, percentages
| Married | 44% | 40% | 45%* |
| Single | 30% | 34% | 35% |
| Divorced | 8% | 10% | 11% |
| Widowed | 7% | 6% | 6% |
| Re-married | 8% | 8% | N/A* |
| Separated | 3% | 2% | 2% |
*In the 2021 Census married and re-married statuses were included together
Note: percentages are independently rounded so may not sum to totals
The proportion of adults who are married has declined over the last several decades. The proportion divorced (and not re-married) has increased from 2.1% in 1971 to 10.9% in 2021.
 gov.je